VR Data Visualization: What Business Analysts Should Learn Today

We all know that Data is becoming even more useful and important. But, just for one second, let us stop and imagine even how more important and useful it would become if it can be visualized more clearly and easily. And this is what VR Data Visualization offers us: the chance to better understand and utilize Data by immersing ourselves in it.
We believe that in the nearest future when virtual reality Data visualization takes its well-deserved place in the scheme of things, our idea of what Data is and how we can use it may change completely. But for the present, let us find out what virtual reality is, how it can be used, as well as what the future holds for it.
What is Virtual Reality
Virtual Reality, by definition (as it relates to AR/VR Data visualization), is a simulated environment created by using sophisticated computer technology. In this type of data handling, the user is immersed in the simulated environment and he/she can experience and interact effectively with the data in this 3-dimensional world. The interaction and experiences are intense and surreal because the technology is designed to stimulate the human senses such as smell, touch, hearing and sight. Through this way, we can both recognize and retain information more easily.
Even though speculations and experimentations on VR and its applications have been circulating since 1960, the current trend of VR in Data visualization only started to develop in 2010 and, as such, the technology itself is still relatively new and still very much evolving.
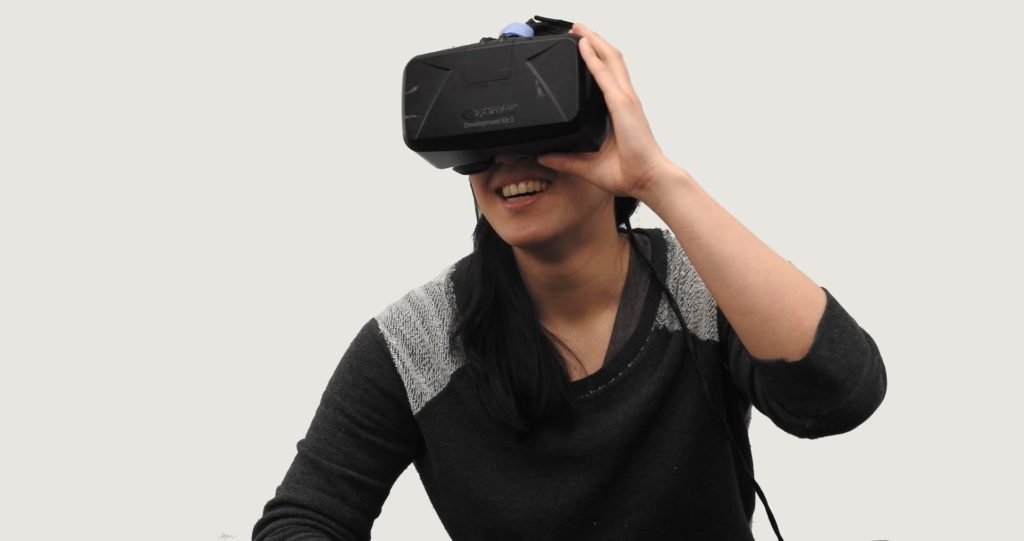
Data visualization with VR work best through the use of devices such as helmets or headsets. These usually help to amplify the senses we have listed above as well as bring the virtual world into reality.
Ways Virtual Reality Can Be Used in Data Visualization
Data is powerful and highly important. It, basically, runs the world. From organizations and companies to governments and industries, it seems as though people depend on Data to make important decisions. And since the advent of the Internet of Things (IoT), the way and manner we collect Data have exploded. So, the problem now is not that we do not have enough data to make clear, quick and efficient decisions, it has become that we now have more data than we can handle, interpret or even use. In fact, according to a recent report by Cisco, only about 1%, or less, of unstructured is analyzed or even put into use.

However, this changes when you bring Data Visualization into the mix. With VR Data visualization, we can quickly and easily interpret captured Data. It makes Data analysis so easy and straightforward that anyone can now make sense of any Data even without having a degree in Statistics.
Let us consider some practical applications of virtual reality visualization.
- Oculus Rift’s Titans of Space
Many people know Oculus as a pioneer developer in VR. They built the first headset VR device that sparked a lot of interest years ago.
Recently, they developed a VR called Titans of Space 2.0. The technology takes all the Data that has been collected about our Solar System and creates a thorough tour of it. This provides a larger perspective of what the Universe contains as well as our place amongst the Stars.
2. Google Labs
This piece of genius by Google captured Data all across Europe to create an interactive guide to the UK’s European Union referendum during Brexit. By interacting with the Data in this technology, the user can see what question people are asking in each country. This provided a useful way to interpret and understand people’s questions and concerns.
3. Wall Street Journal
The Wall Street Journal developed the VR called the 21 Years of the Nasdaq. They simply collected Data on prices and earnings of Nasdaq over the past 21 years to create a VR guided tour for the stock. Anyone who interacts with this virtual reality Data visualization can easily understand Nasdaq’s journey.
4. New York Times’ Seeking Pluto’s Frigid Heart
VR can be applied to create fun experiences like in this case. New York Times gathered Data to build a VR called Seeking Pluto’s Frigid Heart. With it, users can interact and see all the uniqueness of Planet Pluto.
5. Nirvaniq Labs’ Alyssum
Nirvaniq Labs built the application called Alyssum using Canadian Open Data. It allows for interactive Data visualization and users can gather more insights from any Data they are visualizing easily.
Pros and Cons of VR Usage in Data Visualization
Like all things, VR based Data visualization and its numerous applications have their own advantages and disadvantages and we will consider the most important ones.
Pros:
- It makes several types of training easier with higher chances of better understanding
- Many applications of VR make living, working, and traveling more convenient
- VR creates room for effective communication as well as a chance to experience new things
- It also stimulates and encourages collaboration
Cons:
- Overall, VR is expensive to build and apply
- VR may make person-to-person communication obsolete as well as get users addicted to the virtual world
- Risk of internet trolling and bully could be the highest ever
Examples of Data Visualization in VR
Just like augmented reality Data visualization, there are several examples of technologies that are thriving in Data visualization virtual reality. Some of these examples include:
- 3Data
3Data was known as DatavizVR and has been in the business of advancing VR technology since 2016. Today they offer Data visualization solution ranging from AR to VR.
2. BadVR
This company is based in California and offers numerous solutions regarding Data visualization in VR. They found a way to combine AI with Machine Learning so that even large Dataset can be parsed quickly and filtered in real-time. The result is applications that we can use to explore Data in immersive and interactive environments.
3. Virtualitics
This is one company that has been taking long and important strides towards a better virtual reality Data analysis. Their 3 products; Virtualitics Immersive Platform (VIP), Virtualitics Fusion, and Virtualitics Predict, can be easily integrated into any company’s stack to enable easier Data digestion that in turn permits quicker decision making. The products can be used separately or as a whole package.
4. Datavized
Datavized software company has created several VR tools with the most common being Geometric and Immersive 2030. Geometric can be used for building and visualizing 3D geospatial data maps even without codes.
5. DataView VR
Also called D6 VR, this company provides one of the most comprehensive forms of VR-based Data analysis. Using their solutions, we can both visualize and manipulate data at the same time. The Multi-user feature also allows for priceless collaboration.
Current Trends in VR Data Visualization
Currently, Data visualization with VR is gaining acceptance in different fields. Aside, its application in companies, businesses government, gaming, touring, and entertainment, VR is also becoming a major component of medicine and treatment. Doctors employ it in many areas including the treatment of infectious disease.
VR is currently changing the way we view and interact with Data of any size. Recently, it was used in two major cases that made headlines across the globe. One of the cases was when VR Dataviz was used to illustrate how social distancing is vital to impeding the spread of the Coronavirus global pandemic. The second case was when it was, again, used to create a visual of the fatality rates of the Virus in places like North America, Latin America, Europe, Asian as well as other regions.
It is also currently on record that the correct use of Data visualization promotes better and quicker understanding thereby cutting the time for any business meeting by about 24%. VR is therefore vital in helping us arrive at a decision faster.
Spacial and some of their tools, which many now call the VR version of Zoom, saw an increase in their users by about 1000% months ago. All of these just goes to demonstrate how VR visualization is experiencing increased acceptance that can only continue to grow.
Forecast for VR Data Visualization
In the nearest future, 2021 to be precise, the Dataviz with VR market will reach about $6.5 billion and then grow to about $16 billion by the following year. This is especially because VR will most likely experience the even broader application in areas like work, government, businesses, social lives, and education.
One fantastic thing that VR will bring us in the coming years is the Smart Devices. These, many experts have reported, will play a key role in traffic and transportation, improving the way we go about our daily activities.
In the coming days also, it is forecasted that VR will evolve into XR (extended reality). XR will combine AR, VR, and the advent of 5G effortlessly to give us one of the most transformative tech trends yet. It is believed that this technology will make it possible for users to step into the digital space and use all the 5 human senses simultaneously.
Conclusion
VR Data visualization has come to stay. Its applications are spreading into just about any field you can think of and with improvement in technologies like Smartphones and 5G, the future can only hold great things for virtual reality.
This is not to say that there are no dark sides to VR. However, the numerous advantages and almost unlimited potentials it holds in Data visualization outweighs the negatives. We might not even have to worry much about the negatives if only we can apply a little humanness in the development and application of this technology.
The virtual reality world and how it affects Data visualization will keep changing and we will keep creating contents to cover whatever changes occur. It would therefore be nice if you subscribed to our email newsletter so you never miss out on any bits. Also, always share with your friends, we are sure they will thank you for it.

