5 use-cases for ChatGPT as an assistant in data analysis projects

In the information age, data analysis has emerged as a pivotal skill across various sectors, from marketing and finance to healthcare and education. Turning raw data into meaningful insights involves several steps: data cleaning, exploratory data analysis, feature selection, model training, and result interpretation. Each of these tasks requires technical proficiency and significant time and effort. Enter ChatGPT, an AI assistant poised to revolutionize how we handle data analysis projects. In this article, we will explore five specific use cases where ChatGPT has been utilized as an assistant in data analysis projects, dramatically cutting down the time and streamlining the process from data pre-processing to interpretation.
Data cleaning
Data Cleaning: In many real-world datasets, the data is often messy and requires cleaning before any meaningful analysis can be conducted. This includes dealing with missing values, outliers, and inconsistent entries. With ChatGPT, users can simply specify what they want to clean in the data, and the AI will provide the code to do so.
Time Saved Depending on the complexity of the data, this can save several hours that would otherwise be spent writing and debugging code.
Example Dataset staff.csv.
Problem: the dataset has missing and in-consistent values.
Task to ChatGPT:
I have a dataset "staff.csv".
Here are the first few lines of it:
,Name,Age,Department,Salary,Years of Experience
0,Anna Miller,43,Engineering,50000,5
1,Frank Rodriguez,nan,Engineering,60000,7
2,Anna Williams,28,HR,40000,7
3,Frank Smith,36,Sales,40000,Unknown
4,Grace Martinez,38,Marketing,45000,1
5,Ian Brown,29,Sales,65000,4
6,Charlie Williams,27,Engineering,45000,4
7,Jack Davis,36,Marketing,55000,8
8,Charlie Rodriguez,27,HR,65000,5
9,Jack Miller,31,Marketing,75000,1
10,Daniel Jones,28,Engineering,70000,2
11,Charlie Johnson,25,HR,45000,1
12,Hannah Williams,36,nan,Not disclosed,4
13,Ben Brown,36,HR,nan,5
14,Hannah Brown,32,nan,55000,7
15,Grace Smith,26,nan,55000,4
16,Anna Brown,39,Engineering,Not disclosed,1
17,Ella Garcia,45,Sales,70000,Unknown
18,Grace Rodriguez,47,Marketing,65000,Unknown
19,Frank Jones,46,Sales,nan,1
20,Ella Johnson,31,Engineering,Not disclosed,9
21,Grace Miller,Unknown,Engineering,70000,2
22,Frank Garcia,27,Sales,60000,8
23,Charlie Martinez,28,HR,Not disclosed,7
24,Ben Garcia,39,nan,65000,5
25,Daniel Rodriguez,49,Sales,65000,7
26,Ben Miller,41,Marketing,55000,nan
27,Ella Jones,49,Marketing,75000,nan
28,Ian Johnson,46,Engineering,50000,9
29,Charlie Smith,nan,nan,75000,6
30,Ben Smith,44,Engineering,Not disclosed,6
Create a python script to:
- handle missing values
- replace inconsistent entries like 'Unknown' and 'Not disclosed' with appropriate values
- ensure all numerical columns are in the correct data type
Python code from ChatGPT:
import pandas as pd
import numpy as np

# Read the csv file
df = pd.read_csv('staff.csv')

# Convert 'Unknown' and 'Not disclosed' to NaN
df.replace(['Unknown', 'Not disclosed', 'nan'], np.nan, inplace=True)

# Handling missing values
# For numerical columns, fill NaN with the mean value
df['Age'] = pd.to_numeric(df['Age'], errors='coerce')
df['Age'].fillna((df['Age'].mean()), inplace=True)

df['Salary'] = pd.to_numeric(df['Salary'], errors='coerce')
df['Salary'].fillna((df['Salary'].mean()), inplace=True)

df['Years of Experience'] = pd.to_numeric(df['Years of Experience'], errors='coerce')
df['Years of Experience'].fillna((df['Years of Experience'].mean()), inplace=True)

# For categorical columns, fill NaN with the mode (most frequent value)
df['Department'].fillna(df['Department'].mode()[0], inplace=True)

# Convert the numerical columns to integer data type
df['Age'] = df['Age'].astype(int)
df['Salary'] = df['Salary'].astype(int)
df['Years of Experience'] = df['Years of Experience'].astype(int)

# Save cleaned data to csv
df.to_csv('staff_cleaned.csv', index=False)
Result: cleaned dataset staff_cleaned.csv (0 experience in Python required).
Time spent to get clean data: <5 minutes.
Data Exploration
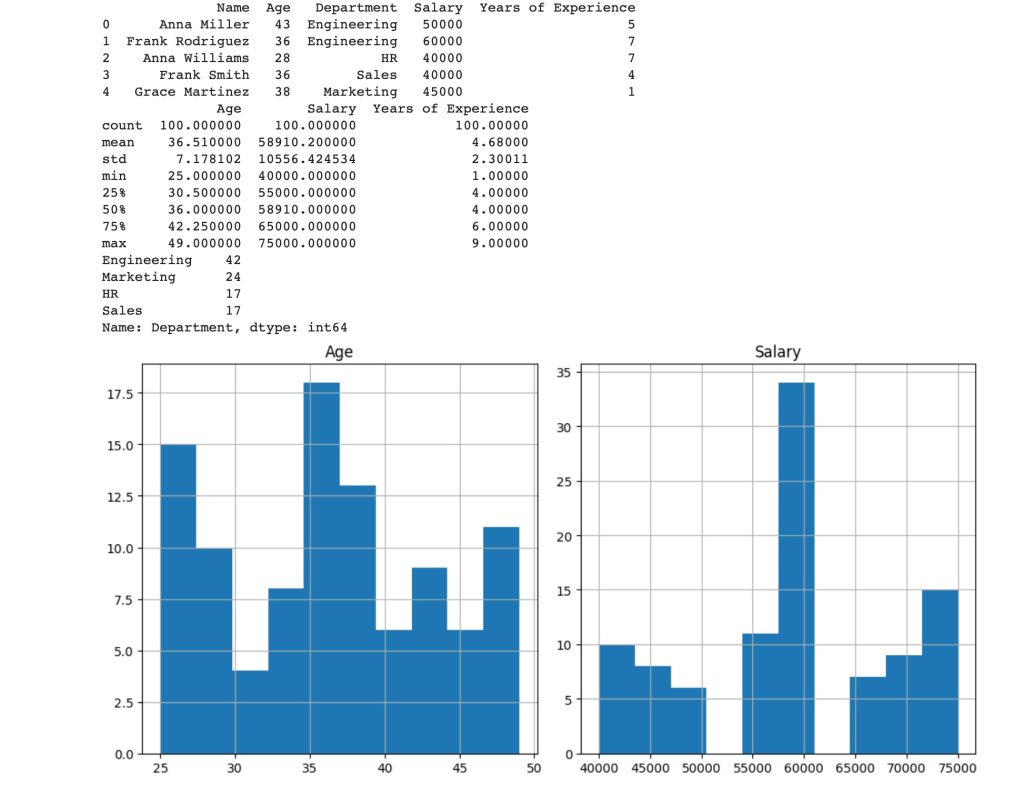
Data Exploration: Exploratory data analysis (EDA) is a critical step in any data analysis project. It involves summarizing the main characteristics of a dataset, often through statistical graphics and other data visualization methods. With ChatGPT, users can easily explore their data by asking the AI to generate code for different plots or statistical summaries.
Time Saved The time saved can vary greatly, but typically this can save a few hours.
Example Dataset staff_cleaned.csv.
Problem: we want to explore the data.
Task to ChatGPT:
 I have a dataset "staff_cleaned.csv". Here are the first few lines of it:
Unnamed: 0,Name,Age,Department,Salary,Years of Experience
0,Anna Miller,43,Engineering,50000,5
1,Frank Rodriguez,36,Engineering,60000,7
2,Anna Williams,28,HR,40000,7
3,Frank Smith,36,Sales,40000,4
4,Grace Martinez,38,Marketing,45000,1
5,Ian Brown,29,Sales,65000,4
6,Charlie Williams,27,Engineering,45000,4
7,Jack Davis,36,Marketing,55000,8
8,Charlie Rodriguez,27,HR,65000,5
9,Jack Miller,31,Marketing,75000,1
10,Daniel Jones,28,Engineering,70000,2
11,Charlie Johnson,25,HR,45000,1
12,Hannah Williams,36,Engineering,58910,4
13,Ben Brown,36,HR,58910,5
14,Hannah Brown,32,Engineering,55000,7
15,Grace Smith,26,Engineering,55000,4
16,Anna Brown,39,Engineering,58910,1
17,Ella Garcia,45,Sales,70000,4
18,Grace Rodriguez,47,Marketing,65000,4
19,Frank Jones,46,Sales,58910,1
20,Ella Johnson,31,Engineering,58910,9
21,Grace Miller,36,Engineering,70000,2
22,Frank Garcia,27,Sales,60000,8
23,Charlie Martinez,28,HR,58910,7
24,Ben Garcia,39,Engineering,65000,5
25,Daniel Rodriguez,49,Sales,65000,7
26,Ben Miller,41,Marketing,55000,4
27,Ella Jones,49,Marketing,75000,4
28,Ian Johnson,46,Engineering,50000,9

I want to explore the dataset from various angles.Please create a python script to help me do that.
Python code from ChatGPT:
import pandas as pd
import matplotlib.pyplot as plt
import seaborn as sns
# Read the csv file
df = pd.read_csv('staff_cleaned.csv')
# Drop the unnecessary column
df = df.drop(['Unnamed: 0'], axis=1)
# Display the first few rows of the dataframe
print(df.head())
# Display the summary statistics
print(df.describe())
# Display the count of each department
print(df['Department'].value_counts())
# Display histograms for each numerical column
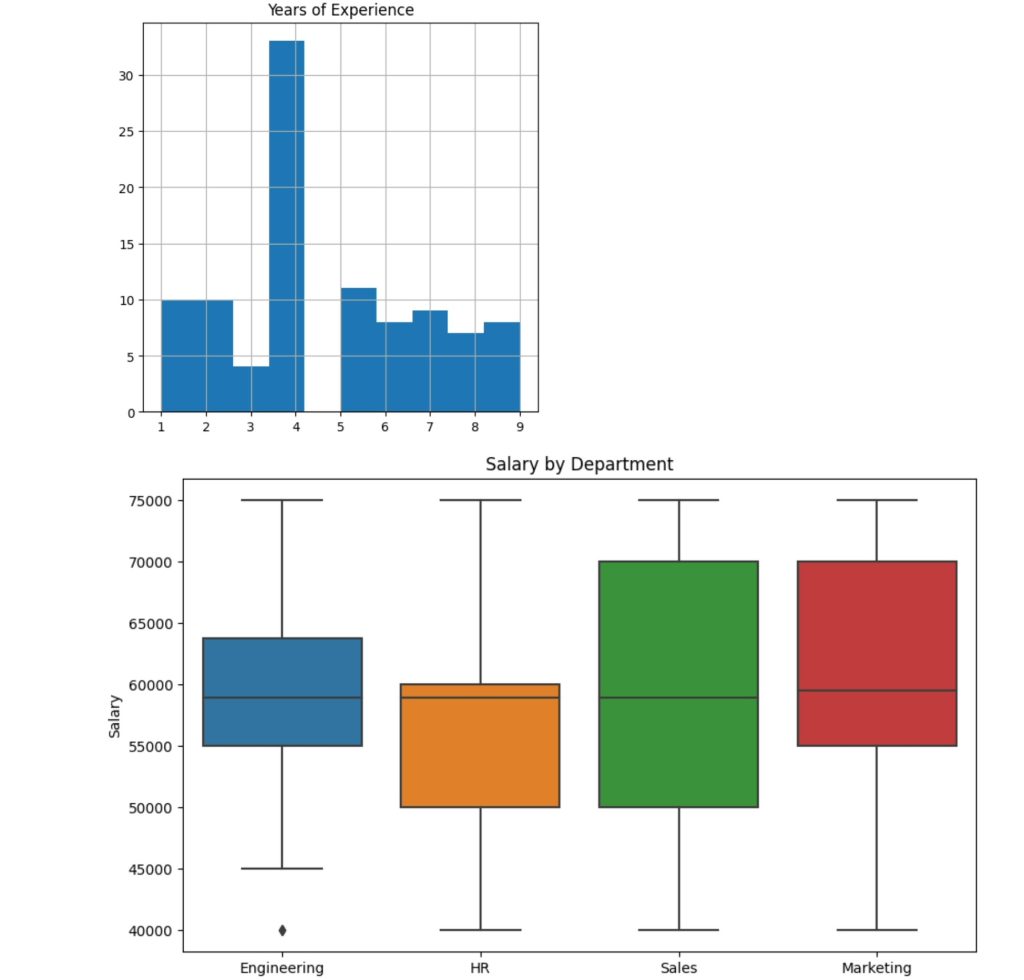
df.hist(figsize=(10, 10))
plt.tight_layout()
plt.show()
# Display a boxplot for Salary grouped by Department
plt.figure(figsize=(10, 6))
sns.boxplot(x='Department', y='Salary', data=df)
plt.title('Salary by Department')
plt.show()
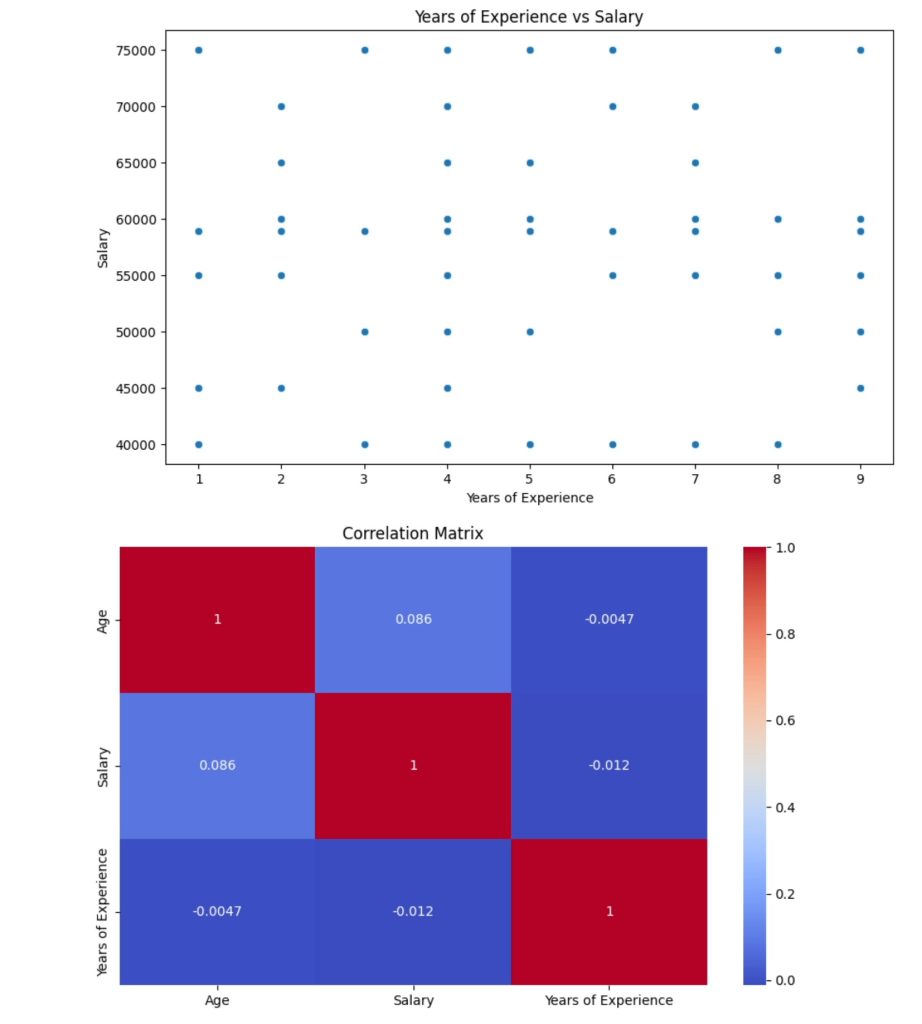
# Display a scatter plot of Years of Experience vs Salary
plt.figure(figsize=(10, 6))
sns.scatterplot(x='Years of Experience', y='Salary', data=df)
plt.title('Years of Experience vs Salary')
plt.xlabel('Years of Experience')
plt.ylabel('Salary')
plt.show()
# Display the correlation matrix as a heatmap
plt.figure(figsize=(10, 6))
sns.heatmap(df.corr(), annot=True, cmap='coolwarm')
plt.title('Correlation Matrix')
plt.show()


Result: various visualizations that help explore the data have been created (0 experience in Python required).
Time spent to get visualizations: <5 minutes.
Feature Selection
Feature Selection: Choosing the right features for a machine learning model is often a time-consuming process that requires domain knowledge and statistical skills. With ChatGPT, users can ask the AI for advice on which features might be important based on a given dataset. The AI can also provide code to implement different feature selection methods.
Time Saved This can save several hours to a few days, depending on the complexity and size of the dataset.
Example Dataset population_data.csv.
Problem: we want to select the features from the dataset that may predict income level.
Task to ChatGPT:
I have a dataset "population_data.csv".
Here are the first few lines of it:
,age,education,marital_status,occupation,working_hours_per_week,gender,capital_gain,capital_loss,income_level
0,64,4,1,2,51,1,9500,13500,0
1,67,3,1,2,41,1,16000,19000,0
2,20,2,2,1,54,1,2000,7000,0
3,23,3,2,4,21,1,8500,8500,0
4,23,4,1,2,25,1,14500,1500,1
5,59,4,3,5,58,1,19000,12500,1
6,29,3,4,5,51,1,13000,12000,1
7,39,2,1,4,48,0,12500,15500,0
8,41,4,3,4,58,1,9000,11500,0
9,56,4,1,1,24,1,10000,7500,1
10,43,2,2,1,57,0,3500,10500,0
11,26,4,3,3,27,1,17000,14500,1
12,44,4,3,5,23,1,14000,11000,1
13,44,3,1,3,41,1,16000,12000,1
14,32,1,4,5,41,1,19000,1500,1
15,21,4,1,3,46,1,6000,4500,1
16,58,4,4,1,22,0,12000,19000,0
17,59,3,3,2,48,1,3500,0,1
18,43,1,4,4,52,0,4500,7500,0
I want to select features for a machine learning model predicting income level.
Please generate Python code for feature selection using different methods and explain like to a 15 year old how to interpret the results and select the features.
Python code from ChatGPT:
import pandas as pd
from sklearn.feature_selection import SelectKBest, chi2
from sklearn.ensemble import RandomForestClassifier
import matplotlib.pyplot as plt
import seaborn as sns
# Load the data
df = pd.read_csv('population_data.csv')
df = df.drop(df.columns[0], axis=1)  # drop the first unnamed column
# Separate features and target variable
X = df.drop('income_level', axis=1)
y = df['income_level']
# Correlation analysis
plt.figure(figsize=(12, 10))
sns.heatmap(X.corr(), annot=True, fmt=".2f")
plt.show()
# Chi-squared test
selector = SelectKBest(score_func=chi2, k='all')
fit = selector.fit(X, y)
# Summarize scores
print('Chi-squared scores:')
for i in range(len(fit.scores_)):
    print(f'{X.columns[i]}: {fit.scores_[i]}')
# Random Forest
model = RandomForestClassifier(random_state=1)
model.fit(X, y)
# Display feature importance
feature_importances = pd.DataFrame(model.feature_importances_,
                                   index = X.columns,
                                   columns=['importance']).sort_values('importance', ascending=False)
print(feature_importances)
Additional task to ChatGPT to interpret the results:
Here's what I got for points 2-3:
Chi-squared scores:
age: 4.625748199952593
education: 0.9619843143010278
marital_status: 0.09272511492933165
occupation: 0.2531095471859908
working_hours_per_week: 14.965430674328452
gender: 0.03357472021066464
capital_gain: 1077492.2012987817
capital_loss: 1251329.231389219
                        importance
capital_loss              0.417510
capital_gain              0.366830
age                       0.065734
working_hours_per_week    0.062012
occupation                0.028924
marital_status            0.024451
education                 0.022937
gender                    0.011601
Interpret it in terms that a 15-year old would comprehend and select the features for my machine learning model.
**Chi-squared scores:** This is a bit like seeing which of your video game characters' skills contribute most to winning a game. The bigger the number, the more impactful the skill is. For example:
- **Capital_gain** (1077492.20) and **Capital_loss** (1251329.23) are like your character's "power level" in a game - they greatly affect the outcome. You definitely want these in your team!
- **Age** (4.62) and **Working_hours_per_week** (14.96) are akin to lesser but still important skills like "speed" or "stamina". They're not as powerful, but can still make a difference in the game.
- The other skills (**Education**, **Marital_status**, **Occupation**, **Gender**) are quite low, making them less useful for winning the game. They're like having a "charisma" or "luck" skill in a combat-focused game - not totally useless, but there are better options.
**Random Forest feature importance:** This is like having a seasoned gamer rank your characters based on how useful they are overall, considering all their skills.
- Again, **Capital_loss** and **Capital_gain** top the list. They're clearly your star players!
- Other features like **Age** and **Working_hours_per_week** are still valuable team members, just not as strong.
- **Occupation**, **Marital_status**, **Education**, **Gender** have much less importance - they're like side characters who don't do much in the game.
Considering all these, for your machine learning model (your "gaming team"), you'd definitely want to select **Capital_gain** and **Capital_loss** - they're your MVPs. You should probably include **Age** and **Working_hours_per_week** too - they're your reliable team members. The rest (Education, Marital_status, Occupation, Gender) might not contribute as much, but if your team has room, you could consider including them too. In the end, the final decision also depends on the specifics of your game (or model) - so it's always a good idea to experiment!
Result: Features selected.
Time spent to get the results: <10 minutes.
Model Training and Evaluation
Model Training and Evaluation: Training a machine learning model requires an understanding of various algorithms, their assumptions, and how to fine-tune their parameters. Additionally, evaluating a model's performance requires knowledge of different metrics and methods. ChatGPT can simplify this process by providing code to train and evaluate different models based on the user's needs.
Time Saved Depending on the model's complexity, this can save several days of work.
Example: Model training is a complex topic and goes beyond the content of this article. We may post a separate article about it or you can learn how to do it using ChatGPT in my course. Interested in learning ChatGPT for Data Science? Grab it here.
Results Interpretation
Interpretation of Results: Once a model is trained, interpreting its results and making decisions based on those results can be a challenge. This is especially true for complex models like neural networks. With ChatGPT, users can ask the AI to explain the results in a simplified manner, helping them make informed decisions.
Time Saved This can save a few hours of time, especially for users without a background in data science.
Example 1 See Feature Selection section example.
Example 2 Problem: we trained our model and got results, but they are very technical.
Task to ChatGPT:
Given the results given by the model:
```
1. Classification report:
precision    recall  f1-score   support
           0       0.83      0.88      0.85       150
           1       0.79      0.72      0.75        90
    accuracy                           0.82       240
   macro avg       0.81      0.80      0.80       240
weighted avg       0.82      0.82      0.82       240
2. Confusion matrix:
[[132  18]
 [ 25  65]]
3. Feature importances:
age                      0.32
education                0.18
marital_status           0.10
occupation               0.10
working_hours_per_week   0.14
gender                   0.06
capital_gain             0.05
capital_loss             0.05
```
Please interpret them.
ChatGPT response:
Sure, let's break down each of these parts:
**1. Classification Report:**
This report provides key metrics about the performance of your model:
- **Precision:** This tells us what proportion of positive identifications was actually correct. For instance, for class 0, a precision of 0.83 means that 83% of the samples that the model classified as 0 were indeed 0. Likewise, a precision of 0.79 for class 1 means that when the model predicted an example as class 1, it was correct 79% of the time.

- **Recall:** This is also known as sensitivity, hit rate, or true positive rate (TPR). It tells us what proportion of actual positives was identified correctly. For class 0, a recall of 0.88 means that the model correctly identified 88% of all true class 0 examples. Similarly, for class 1, it correctly identified 72% of all true class 1 examples.

- **F1-score:** This is the harmonic mean of precision and recall. It tries to find the balance between precision and recall. An F1 score reaches its best value at 1 (perfect precision and recall) and worst at 0.

- **Support:** This is the number of samples of the true response that lies in that class. For instance, there are 150 samples of class 0 and 90 samples of class 1 in the test set.

- **Macro Avg:** This is the average precision, recall, or F1 score between classes. If class distribution is imbalanced, this might be a better measure than the weighted average.

- **Weighted Avg:** This is the average precision, recall, or F1 score, but when it computes the average, it takes into account the number of samples in each class.
**2. Confusion Matrix:**
The confusion matrix looks like this:
```
    | Predicted:0 | Predicted:1
----|-------------|------------
True:0 |     132     |     18
True:1 |     25      |     65
```
- The first row of this matrix considers the samples that are actually of class 0. Out of these 150 (132+18), 132 were correctly classified by the model (true positives for class 0), and 18 were incorrectly predicted as class 1 (false negatives for class 0).

- The second row considers the samples that are actually of class 1. Out of these 90 (25+65), the model correctly predicted 65 (true positives for class 1), and it predicted 25 as class 0 incorrectly (false negatives for class 1).
**3. Feature Importances:**
This part tells you which features were most influential in the model making its decision:
- **Age** was the most important feature, contributing 32% to the model's decision-making process.

- **Education** was the second most important, contributing 18%.

- The least important features were **Capital_gain** and **Capital_loss**, each contributing just 5% to the decision-making process.
In summary, the model performs reasonably well in predicting both class 0 and class 1 with a good balance between precision and recall. The most important factors for the model's predictions were Age and Education. However, this might not be the best possible model, as there seems to be room for improvement, especially in correctly classifying true class 1 examples. It could be useful to look into techniques for improving the model's performance, such as hyperparameter tuning or using a different model type.
Same explained on a simpler level:
Sure, I'd be happy to explain it in simpler terms!
**1. Classification Report:**
Think of this like a video game scoreboard. It tells you how well your machine learning model (or 'game character') performed in the game of predicting income levels.
- **Precision** is like the game character's accuracy in hitting targets. The model had an accuracy of 83% for class 0 and 79% for class 1, which means that when it predicted a person to be in class 0 or 1, it was correct 83% and 79% of the time, respectively.

- **Recall** is like the game character's ability to discover hidden items. The model was able to find 88% of the actual class 0 cases and 72% of the actual class 1 cases.

- **F1-score** is a way to balance precision and recall. It's like wanting to know overall how good your character is, considering both accuracy and discovery skills.

- **Support** is just the number of times each income class appears in the test set.
**2. Confusion Matrix:**
This is another part of the scoreboard showing how many hits and misses the model had.
- The first row shows that out of all the actual class 0 cases, the model correctly predicted 132 and missed 18 (it thought they were class 1).

- The second row shows that out of all the actual class 1 cases, the model correctly predicted 65 but missed 25 (it thought they were class 0).
**3. Feature Importances:**
This is like a character's attributes in a game. Age (like strength) has the highest score (0.32), meaning it was the most useful attribute in predicting a person's income level. Education (like agility) comes next. Capital gain and capital loss (like charisma or luck) had the least importance, meaning they didn't help much in the game.
In short, the model plays the game fairly well, but it still misses some points. Just like in gaming, with more practice (or training) and strategy adjustments, the model can hopefully get better scores!
Result: I got the interpretation of the model results in 2 difficulty levels practically in no time.
Time spent to get the results: <5 minutes.
You can play around with all of the examples above in ChatGPT: https://chat.openai.com/share/5770391d-4dfd-4006-93d2-faf7183b1a55
To wrap up, the advent of ChatGPT has brought about a significant transformation in the landscape of data analysis. With its ability to simplify complex tasks, provide expert advice, and dramatically cut down the time required for various stages of data analysis, it has become a powerful tool for data scientists, business analysts, researchers, and even beginners in the field. It's important to remember that the time saved as described in the five use-cases above can vary based on various factors like user familiarity with data analysis, dataset complexity, and specific project requirements. Nevertheless, integrating ChatGPT into your data analysis toolkit promises to unlock new efficiencies, allowing you to focus more on strategic decisions and less on the technical hurdles. The future of data analysis with AI assistance looks bright, and it's exciting to imagine what further advancements are just around the corner.


